Activity 15: RDDs Solution#
2025-11-03
import numpy as np
import matplotlib.pyplot as plt
import pandas as pd
import seaborn as sns
import statsmodels.formula.api as smf
gov_transfers = pd.read_csv("~/COMSC-341CD/data/gov_transfers.csv")
The columns we have in the dataset are:
\(R\)
Income_Centered: the predicted income of the household, centered at 0\(T\)
Participation: whether the household participated in the poverty alleviation program\(Y\)
Support: the amount of goverment support, encoded as a survery question:In relation to the previous government, do you believe that the current government is worse (0), the same (1/2), better (1)?
gov_transfers.head()
| Income_Centered | Participation | Support | |
|---|---|---|---|
| 0 | 0.006571 | 0 | 1.0 |
| 1 | 0.011075 | 0 | 1.0 |
| 2 | 0.002424 | 0 | 1.0 |
| 3 | 0.007650 | 0 | 0.5 |
| 4 | 0.010001 | 0 | 1.0 |
Part 1#
Let’s first visualize how the treatment assignment is related to the income. Use pd.cut with bins=20 and labels=False to bin the income data into 20 bins:
# TODO your code here
gov_transfers['income_bin'] = pd.cut(x=gov_transfers['Income_Centered'], bins=20, labels=False)

gov_transfers.head(10)
gov_transfers['income_bin'].dtype
dtype('int64')
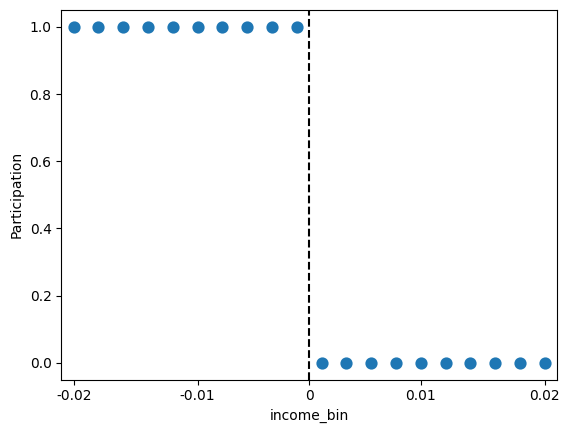
Next, generate a sns.pointplot of y=Participation vs x=income_bin. Set linestyle='none' to plot the points individually.
Discuss with folks around you: Do you observe any deviations from the policy of assigning participation in the transfer program based on income? Does this suggest that the RDD is “sharp” or not?
Your response: pollev.com/tliu
# TODO your code here
sns.pointplot(x='income_bin', y='Participation', data=gov_transfers, linestyle='none')
# convert the xticks to the same units as the original income data
plt.xticks(ticks=[0, 5, 9.5, 14, 19], labels=[-0.02, -0.01, 0, 0.01, 0.02])
# plot the cutoff as a vertical line
plt.axvline(x=9.5, color='black', linestyle='--', label='Income cutoff')
<matplotlib.lines.Line2D at 0x30d569490>
Part 2#
Now we’ll look at the outcome variable, Support. Generate a sns.pointplot of y=Support vs x=income_bin. Set linestyle='none' to plot the points individually.
print(gov_transfers['Support'].value_counts())
# TODO your code here
sns.pointplot(x='income_bin', y='Support', data=gov_transfers, linestyle='none')
plt.xticks(ticks=[0, 5, 9.5, 14, 19], labels=[-0.02, -0.01, 0, 0.01, 0.02])
plt.axvline(x=9.5, color='black', linestyle='--', label='Income cutoff')
Support
1.0    1313
0.5     476
0.0     159
Name: count, dtype: int64
<matplotlib.lines.Line2D at 0x30d5c9790>

On Worksheet 5, we fit two linear regressions on either side of the cutoff to estimate the average treatment effect for an RDD. Another approach to estimating the average treatment effect is to fit a single linear regression that allows the slope to change at the cutoff:
Since \(c=0\), this simplifies to:
The average treatment effect at the cutoff is then given by \(\beta_2\).
# TODO your code here
# Y: Support
# R: Income_Centered
# T: Participation
# Y = beta_0 + beta_1 X + beta_2 X2
formula = 'Y ~ 1 + X + X2'
rdd_formula = 'Support ~ 1 + Income_Centered + Participation + Income_Centered * Participation'
rdd_model = smf.ols(rdd_formula, data=gov_transfers).fit()
print(rdd_model.params['Participation'])
0.09985188527415872
What is your estimate of the average treatment effect at the cutoff (rounded to 1 decimal place)?
Your response: pollev.com/tliu
Acknowledgements#
This activity uses data from Nick Huntington-Klein’s causaldata package.