
Lecture 5 live coding complete#
2026-09-29
import pandas as pd
import numpy as np

import matplotlib.pyplot as plt
import seaborn as sns

from nhanes.load import load_NHANES_data
Bootstrap plotting#
The normal distribution#
A probability distribution that we will frequently encounter in addition to the categorical distributions we saw in worksheet 1 is the normal distribution. The normal distribution has the following properties:
centered and symmetric about the mean \(\mu\) (or \(E[X]\))
spread by the standard deviation \(\sigma\)
the variance is \(\sigma^2\) (or \(V[X]\))
We write a random variable as \(X\) that follows a normal distribution as \(X \sim \mathcal{N}(\mu, \sigma^2)\).
Tip
Watch whether the software you are using takes the variance or the standard deviation as input. In numpy, it is the standard deviation, which is different than how we write the distribution above.
We can draw random samples from the normal distribution using numpy.random.Generator.normal():
# This creates a generator with a fixed seed, so we can generate the same random numbers
rng = np.random.default_rng(seed=42)

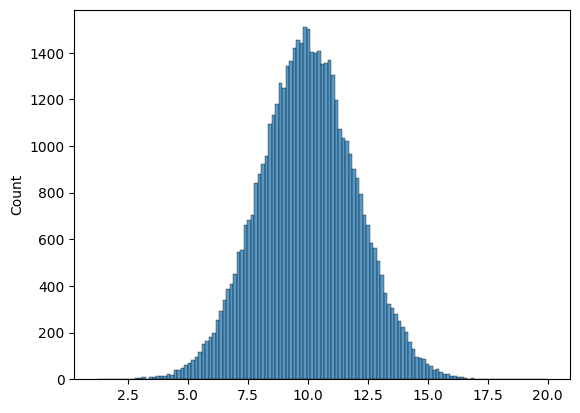
# generate 50000 samples from a normal distribution with E[X]=10 and standard deviation 2
n_samples = 50000
goose_samples = rng.normal(loc=10, scale=2, size=n_samples)
# n_samples = 50000
# goose_samples = rng.normal(loc=10, scale=2, size=n_samples)
goose_samples.shape
(50000,)
# Use seaborn to create a histogram of the samples
sns.histplot(goose_samples)
# sns.histplot(goose_samples);
<Axes: ylabel='Count'>
# Make a sample of 10 from the normal distribution
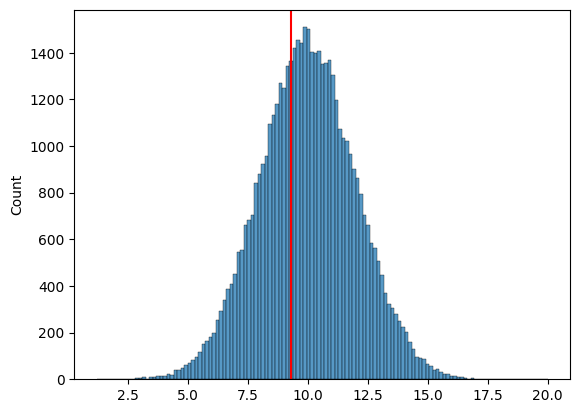
sample = goose_samples[:10]
goose_mean = np.mean(sample)

# in reality, we don't have access to the "true" distribution, which is why it's commented out
sns.histplot(goose_samples)
plt.axvline(x=goose_mean, color='red')
# sns.histplot(goose_samples)
# plt.axvline(x=goose_mean, color='red');
<matplotlib.lines.Line2D at 0x13a2f6cd0>
For bootstrap samples, we can use random.Generator.choice() with replacement to draw samples from our dataset.
def mean_estimator(sample):
    """
    An estimator of the expected value E[ ] of the population.

    Args:
        sample (np.array): a sample from the population

    Returns:
        float: the mean of the sample
    """
    return np.mean(sample)
n_samples = 100
true_goose_weight = 10
# in reality, we never know what the distribution actually is
goose_weights = rng.normal(loc=true_goose_weight, scale=2, size=n_samples)
bootstrap_means = []
n_bootstraps = 5000

for i in range(n_bootstraps):
    bootstrap_sample = rng.choice(goose_weights, size=n_samples, replace=True)
    bootstrap_mean = np.mean(bootstrap_sample)
    bootstrap_means.append(bootstrap_mean)


# for i in range(n_bootstraps):
#     # 1. draw a bootstrap sample
#     bootstrap_sample = rng.choice(goose_weights, size=100, replace=True)
#     bootstrap_sample
#     # 2. compute our mean again, with the bootstrap sample
#     bootstrap_mean = mean_estimator(bootstrap_sample)

#     # 3. add our bootstrap_mean to the list
#     bootstrap_means.append(bootstrap_mean)
Plotting our bootstrap estimates#
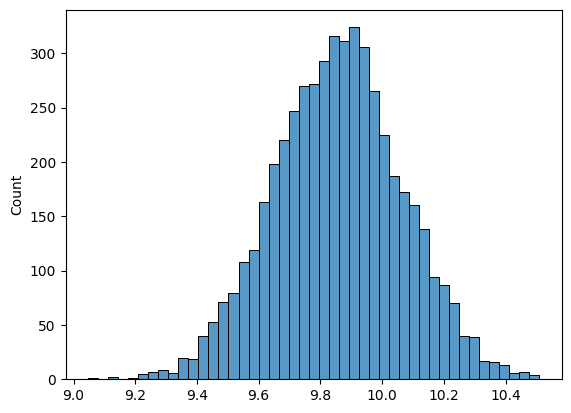
# as our n_bootstraps increase, we're able to see the spread of the estimate
sns.histplot(bootstrap_means)
# fix the xaxis to be between 8 and 12
# plt.xlim(8, 12);
<Axes: ylabel='Count'>
Why we care about uncertainty \(\to\) confidence intervals#
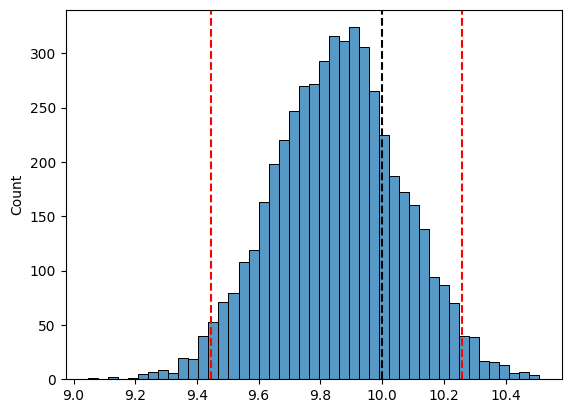
lower_ci = np.percentile(bootstrap_means, 2.5)
upper_ci = np.percentile(bootstrap_means, 97.5)

print(f"Our estimate of average goose weight: {mean_estimator(goose_weights):.1f} lbs")
print(f"95% Confidence Interval: [{lower_ci:.1f}, {upper_ci:.1f}] lbs")

sns.histplot(bootstrap_means)
plt.axvline(true_goose_weight, color='black', linestyle='--', label='True average goose weight')
plt.axvline(lower_ci, color='red', linestyle='--')
plt.axvline(upper_ci, color='red', linestyle='--', label='95% CI')
# plt.xlabel('Bootstrap mean estimates of goose weight (lbs)')
# plt.gca().spines['top'].set_visible(False)
# plt.gca().spines['right'].set_visible(False)
# plt.legend()
# plt.show()
Our estimate of average goose weight: 9.9 lbs
95% Confidence Interval: [9.4, 10.3] lbs
<matplotlib.lines.Line2D at 0x13a9ce0d0>
n_bootstraps = 1000
n_intervals = 500

count_missed = 0

# for j in range(n_intervals):
#     # First draw a new sample from the true distribution
#     goose_sample = rng.normal(loc=true_goose_weight, scale=2, size=100)

#     bootstrap_means = []
#     for i in range(n_bootstraps):
#         # Draw bootstrap samples from this sample
#         bootstrap_sample = rng.choice(goose_sample, size=100, replace=True)
#         bootstrap_mean = mean_estimator(bootstrap_sample)
#         bootstrap_means.append(bootstrap_mean)

#     # Compute CI for this sample
#     lower_ci = np.percentile(bootstrap_means, 2.5)
#     upper_ci = np.percentile(bootstrap_means, 97.5)

#     if true_goose_weight < lower_ci or true_goose_weight > upper_ci:
#         count_missed += 1

# print(f"Number of intervals that missed the true mean: {count_missed}")
# print(f"Proportion of intervals that missed the true mean: {count_missed / n_intervals:.3f}")